Anomaly history view
Note
The Anomaly history view appears only if the anomaly feature is enabled for your company.
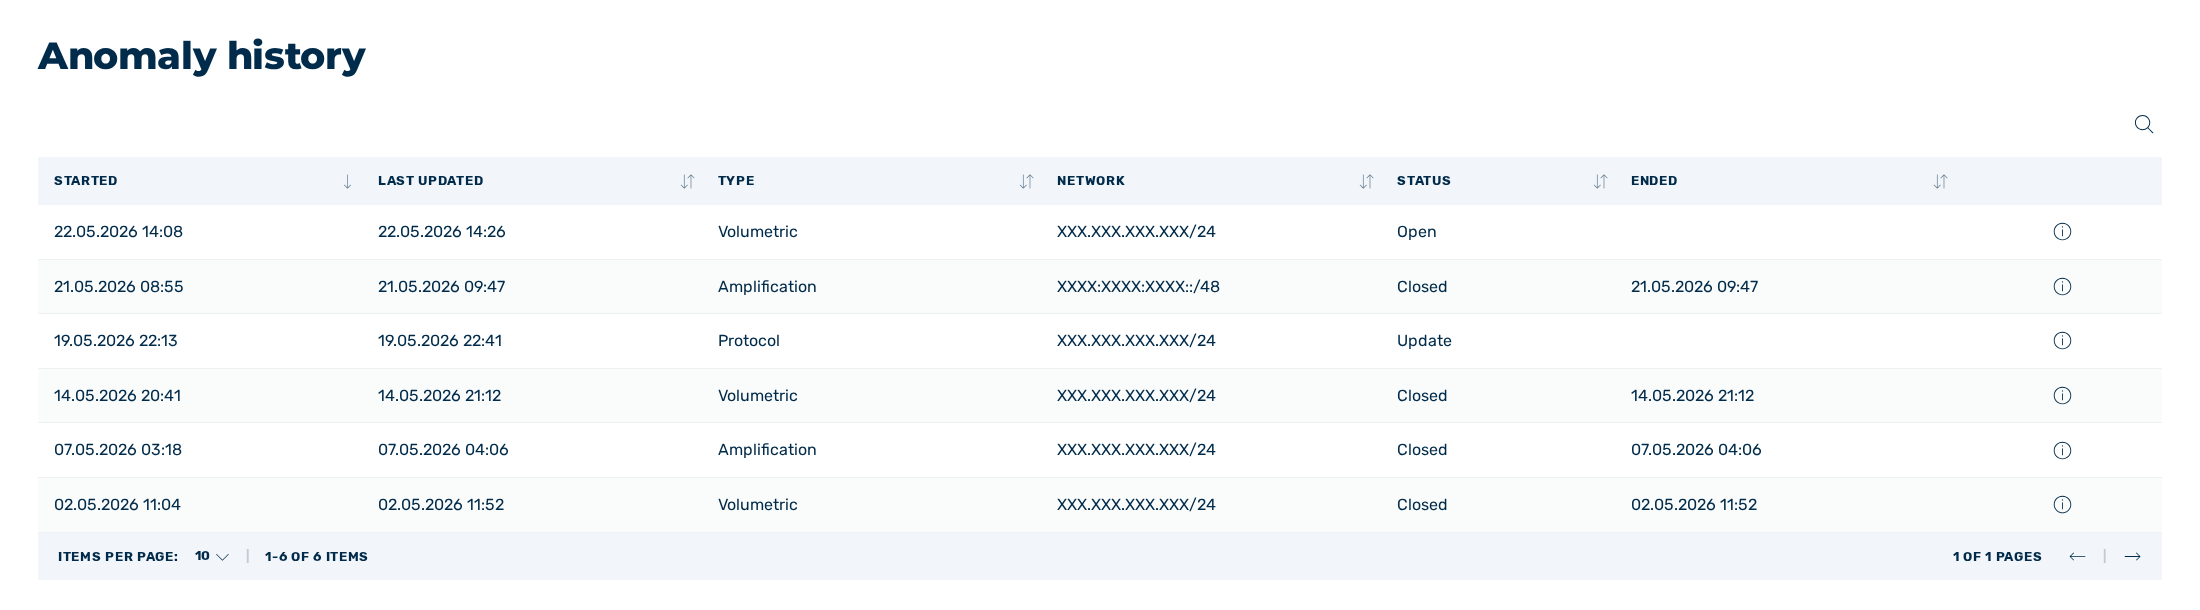
Anomaly history view
In the Anomaly history view, you get an overview of all anomalies detected in the traffic of your networks. By default, the entries are sorted in descending order by the start of the anomaly.
The following information is available:
| Name | Definition |
|---|---|
| Started | The date and time at which the anomaly was detected. |
| Last updated | The date and time at which the entry was last updated. |
| Type | The type of the detected anomaly. The following values are available:
|
| Network | The network in CIDR notation in which the anomaly was detected. |
| Status | The current status of the anomaly. The following values are available:
|
| Ended | The date and time at which the anomaly ended. |
The following options are available:
| Name | Definition |
|---|---|
 |
The View details icon opens the Anomaly details dialog for the selected entry. |
 |
The icon allows you to search by type, network, and status. |
Note
If there are no anomalies, the view displays the text No anomalies found.
Anomaly details dialog
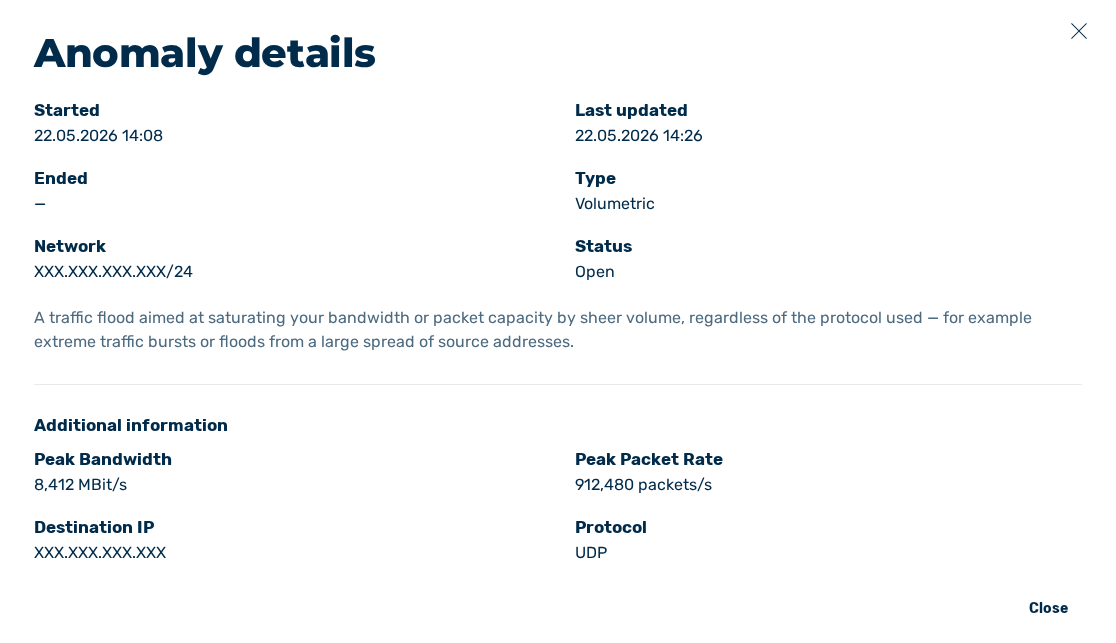
Anomaly details dialog
In the Anomaly details dialog, you can view the following information about an anomaly:
| Name | Definition |
|---|---|
| Network | The network in CIDR notation in which the anomaly was detected. |
| Type | The type of the detected anomaly. |
| Status | The current status of the anomaly. |
| Started | The date and time at which the anomaly was detected. |
| Last updated | The date and time at which the entry was last updated. |
| Ended | The date and time at which the anomaly ended. |
| Additional information | Further details about the anomaly provided by the detection.NoteIf no further details are available, the area displays the text No additional information available. |