Overview Analysis
Overview Analysis
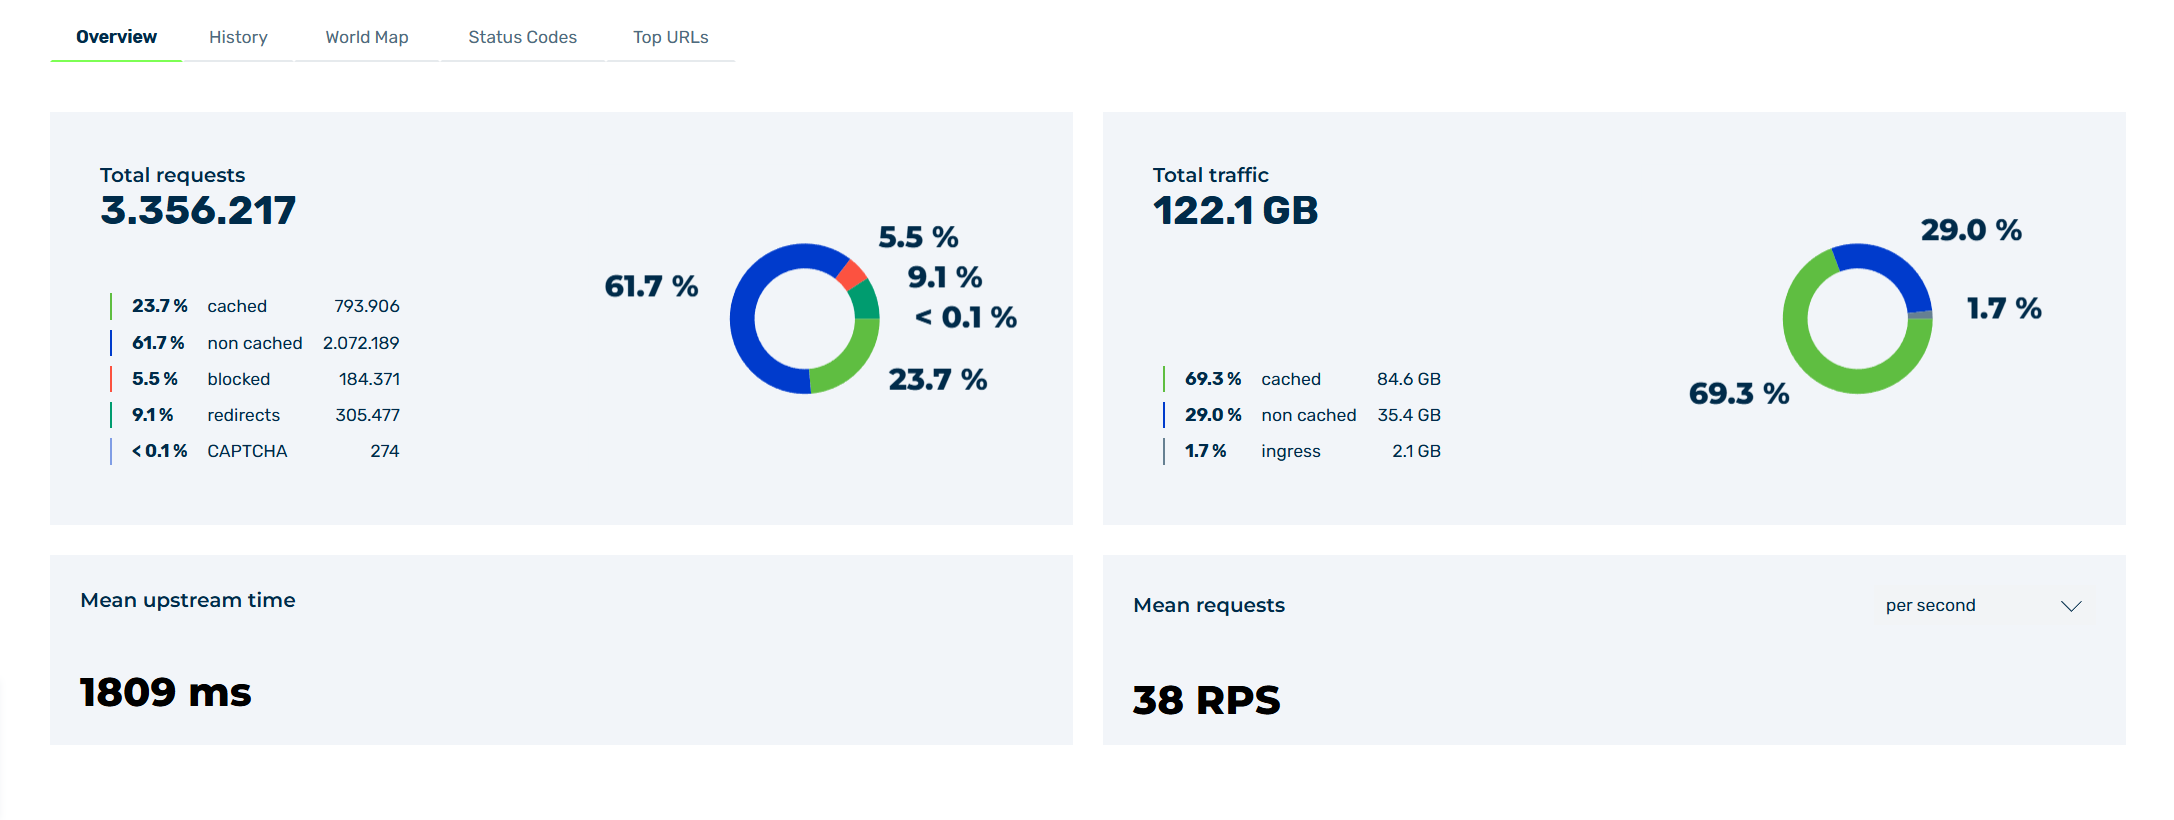
The Overview analysis is divided into four areas and provides an overview of all requests, total traffic, average upstream time, and average requests for the specified time period.
The analysis includes the following areas:
Total requests
This area shows all requests for the selected domains and subdomains. A pie chart with a legend breaks down the different request types. For each request type, the legend shows the percentage and the number of the requests.
The following values are available:
| Name | Definition |
|---|---|
| cached | The requests that were answered from the cache. |
| non cached | The requests that were not answered from the cache. |
| blocked | The requests that were rejected. |
| redirects | The requests that were redirected. |
| CAPTCHA | The requests that a CAPTCHA was sent for. |
Total traffic
This area shows the total traffic volume for the selected domains and subdomains. A pie chart with a legend breaks down the different traffic types. For each traffic type, the legend shows the percentage and the volume.
The following values are available:
| Name | Definition |
|---|---|
| cached | The traffic that was sent from the cache. |
| non cached | The traffic that was not sent from the cache. |
| ingress | The incoming traffic. |
Note
The Total traffic value contains the outgoing traffic including the redirects, and the incoming traffic.
Mean upstream time
This area shows the average upstream time for the selected domains and subdomains.
Mean requests
This area shows the average number of requests for the selected domains and subdomains. In the drop-down list in the top right corner, you define the reference value of the average.
The following values are available:
| Name | Definition |
|---|---|
| per second | Shows the average requests per second. |
| per minute | Shows the average requests per minute. |
| per hour | Shows the average requests per hour. |