Statistics
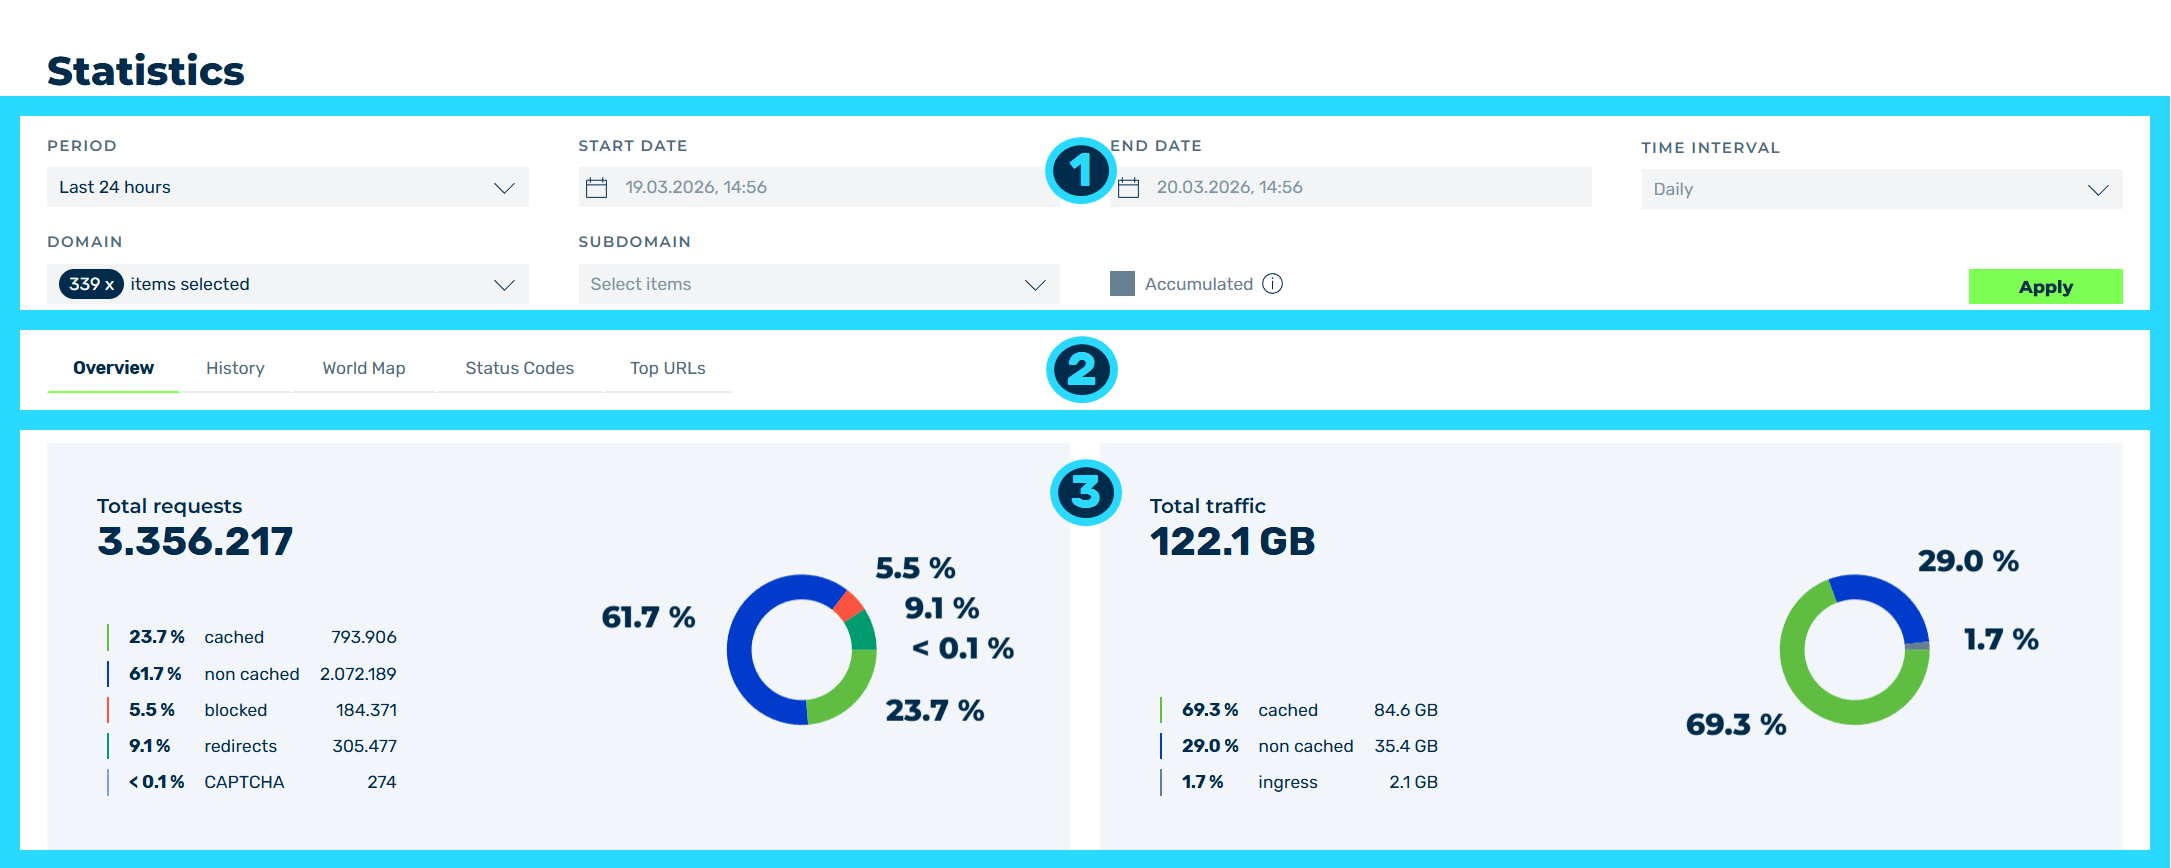
Statistics Overview
In the Statistics view, you can retrieve a detailed analysis of the traffic and requests for one or more active subdomains within a defined time period.
The view includes the following areas:
- ■ Selection area for the time period and the domains and subdomains to be analysed (1)
- ■ Tabs for the different analysis types (2)
- ■ Content area for the graphical representation of the individual analysis areas of the selected domains and subdomains (3)
The following options are available in the selection area for the time period and the domains and subdomains to be analyzed:
| Name | Definition |
|---|---|
| Period |
|
| Start Date | Specifies the start date of the data to be analyzed. |
| End Date | Specifies the end date of the data to be analyzed. |
| Time interval | Defines the time interval for showing the data to be analyzed. The following values are available:
|
| Domain | The multiple selection option selects individual or multiple domains for analysis.NoteIf you open the Statistics view via a domain entry in the Domains view, the domain will be automatically selected and the corresponding data will be shown.NoteIf you have selected one or more domains, you can only select the subdomains of those domains. |
| Subdomain | The multiple selection option selects individual or multiple subdomains for analysis.NoteIf you have selected one or more subdomains, you can no longer select any domains. |
| Accumulated | The selection box consolidates the analysis of multiple domains and subdomains into a single graph.NoteThe Accumulated checkbox is only available for the History analysis. |
| Apply | This button confirms your selection of the time period, domains, and subdomains. |
| Select All | The checkbox under Domains and Subdomain selects all possible domains or subdomains. |
| Reset | The button under Domains and Subdomain clears the selection of all available domains or subdomains. |
You can switch between the individual analysis types and their graphical representations using the tabs with the different analysis types.
Note
If all domains are selected, not every period is available. In this case, the This period is not available when all domains are selected. Allowed periods: note shows with the permitted periods.
Note
If no filter is selected, No data available. Select a filter to view the statistics. shows.
If the analysis contains too many data points, Too many data points. Shorten the time period or increase the time interval. shows. In this case, shorten the period or select a larger time interval.