Status Codes Analysis
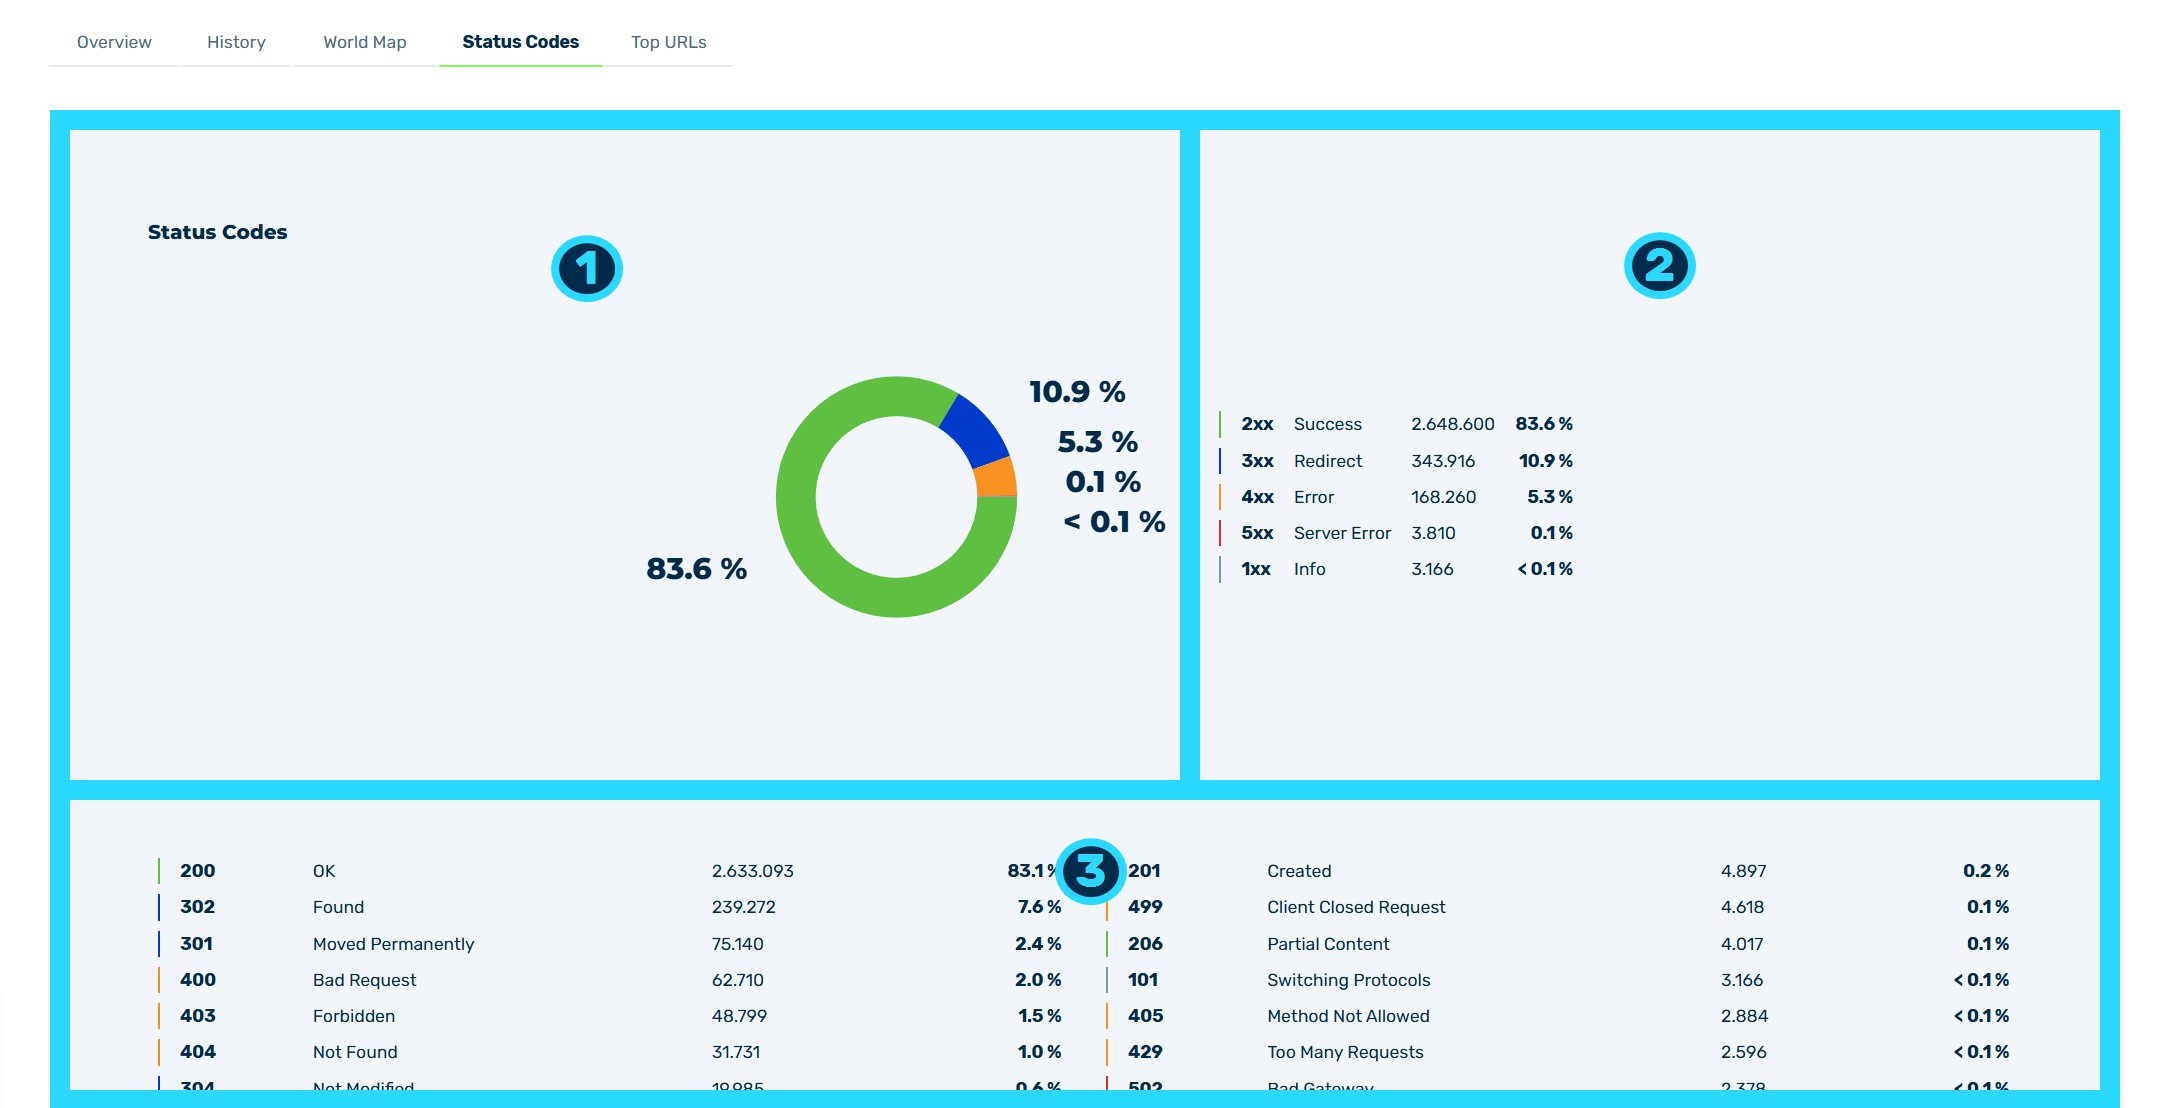
Status Codes analysis
The Status Codes analysis provides an overview of the distribution of the HTTP status codes during the selected period.
The analysis includes the following areas:
- ■ Graphical representation of the HTTP status code distribution as a pie chart (1)
- ■ Legend of the HTTP status code groups, including a description and the number of the requests (absolute / percentage) (2)
- ■ List of the individual HTTP status codes, including a description and the number of the requests (absolute / percentage) (3)
The following status code groups are available in the legend:
| Name | Definition |
|---|---|
| 2xx | Success: The requests that were answered successfully. |
| 3xx | Redirect: The requests that were redirected. |
| 4xx | Error: The requests that caused an error on the client side. |
| 5xx | Server Error: The requests that caused an error on the server side. |
| 1xx | Info: The requests that received an informational response. |
Note
The list of the individual HTTP status codes only shows the status codes that occurred during the selected period.