Overview of the Myra DataHub portal
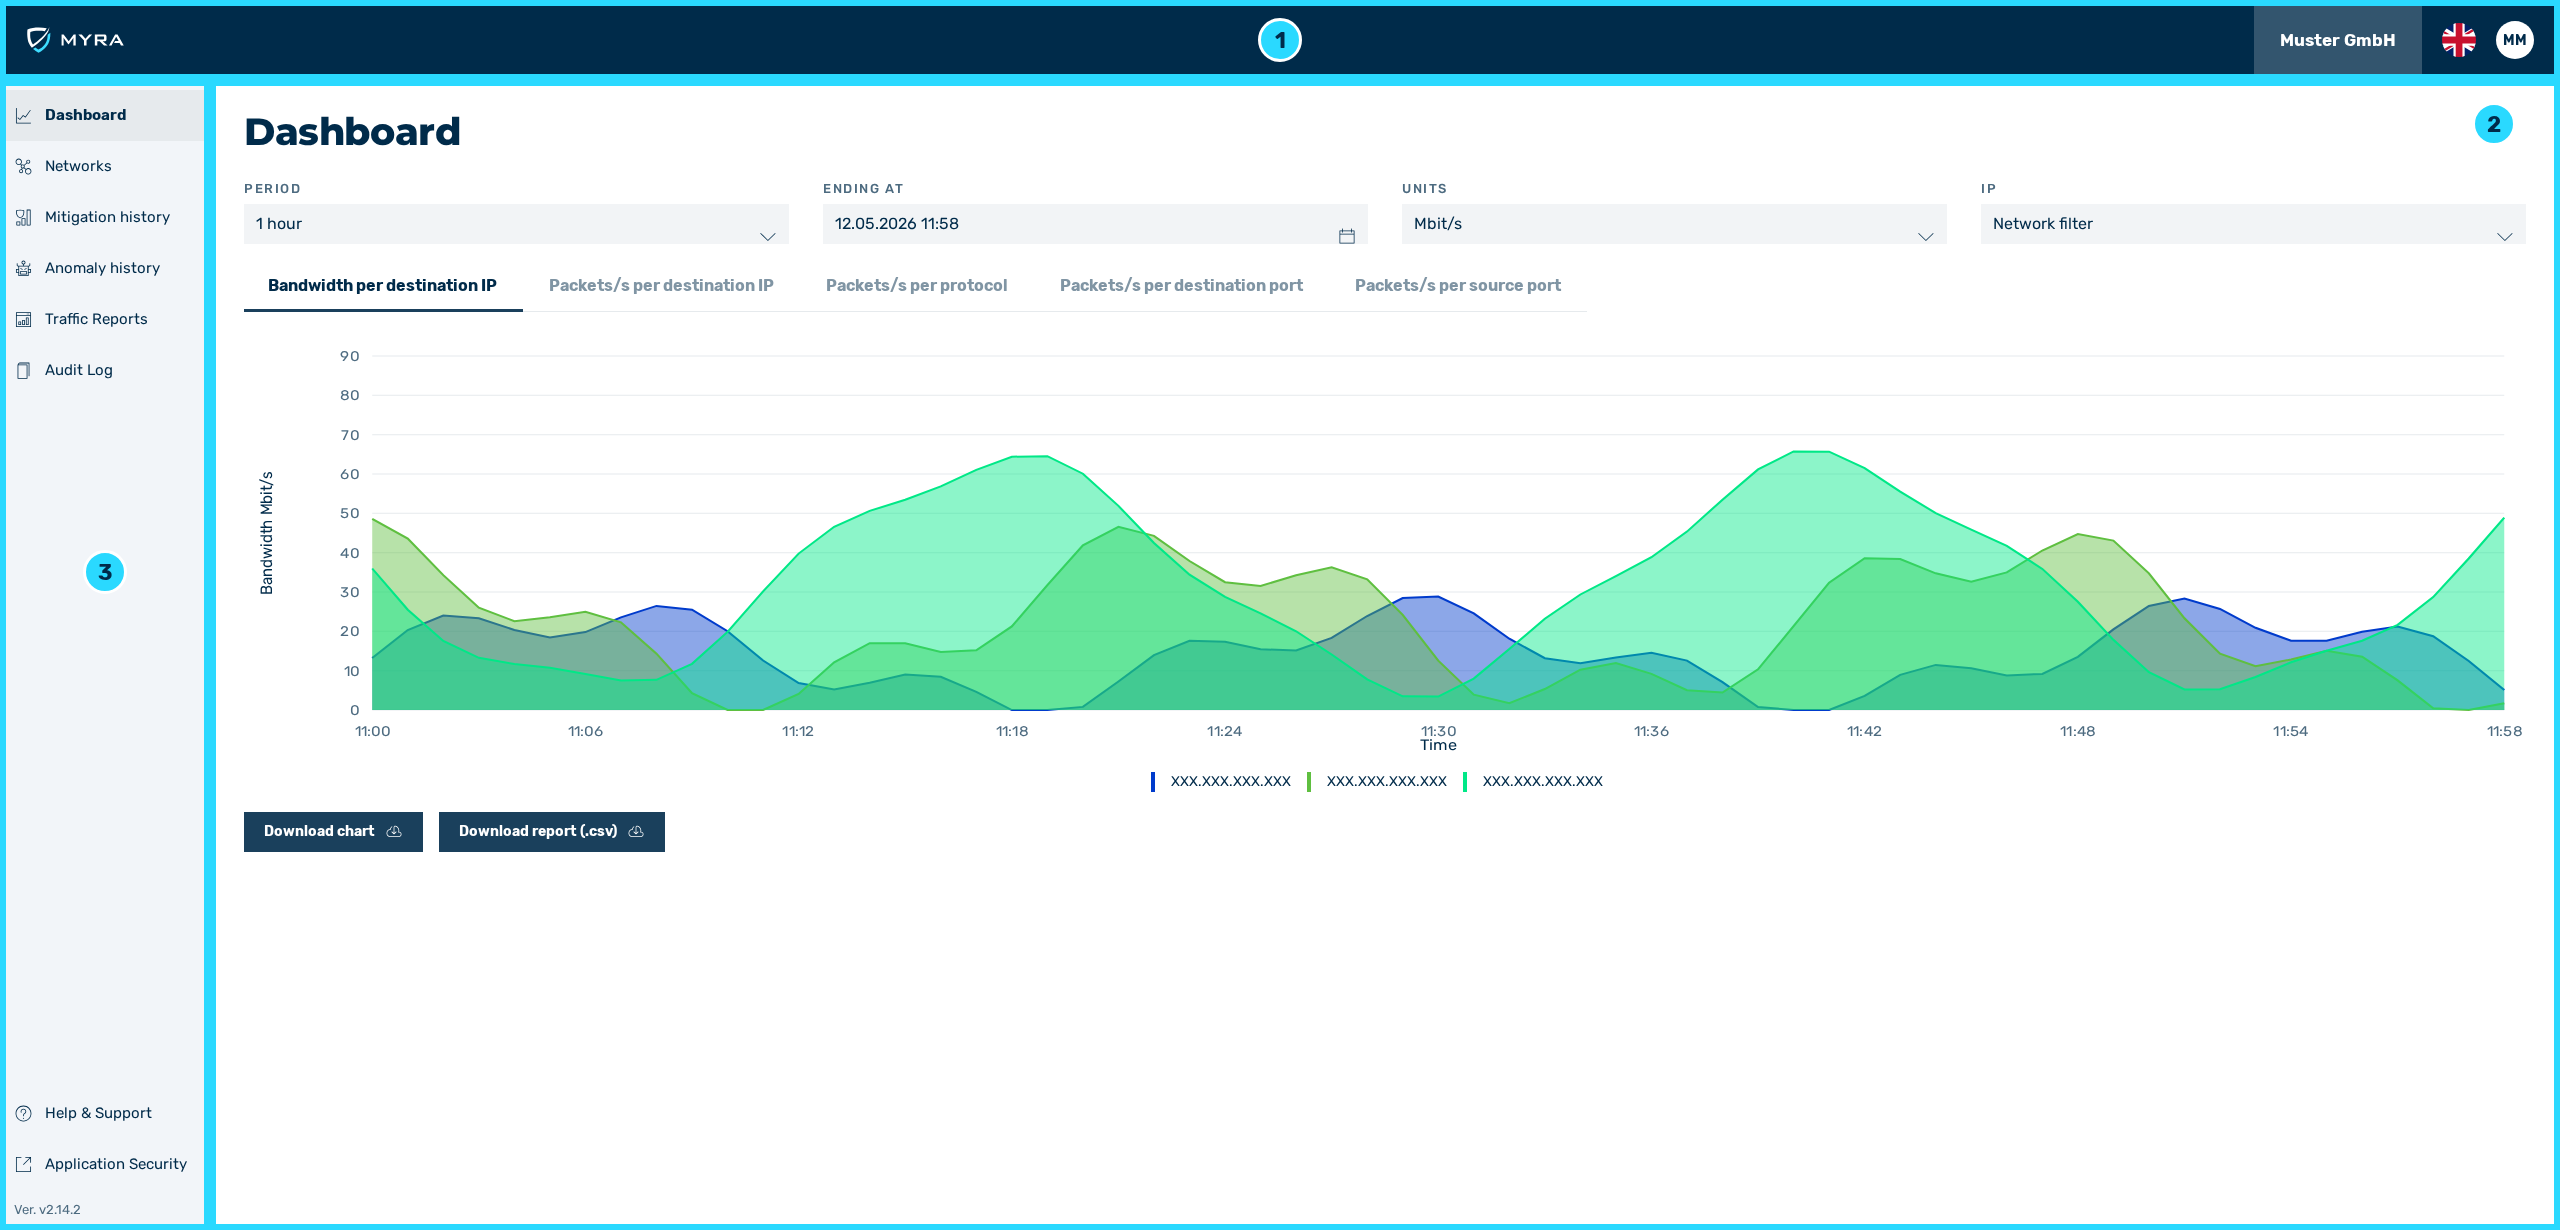
Overview Home
After logging in, the Dashboard home page of the Myra DataHub appears.
On the home page, you can find the following information:
-
■ Top menu bar with access to the following buttons (1)
- ■ Button with the company name for accessing user management
- ■ Button with flag icon for selecting the user interface language
- ■ Button with user profile picture for managing your own account settings
- ■ In the event of maintenance, important information about the type and duration will be shown here as a separate banner.
-
■ Shows the content of the individual views (2)
- ■ Tabs with the following views (3)
- ■
 Dashboard
 - ■
 Networks
 - ■
 Mitigation history
 - ■ Traffic Reports
- ■
 Audit Log
 - ■
 Application Security for opening the Myra App
 - ■ Manual
- ■ Shows the current version number
- ■