Dashboard
Note
The Dashboard view only shows data from domains and subdomains that have been assigned to your account.
Overview of the Dashboard
The Dashboard view is the start page of the Myra App and opens every time the web application is open. It provides a compact overview of all requests and traffic for the past 24 hours for all domains. As root admin you can also see your booked and already used domains as well as active waiting rooms, and receive the most important contact information for Myra.
The Dashboard view includes the following areas:
-
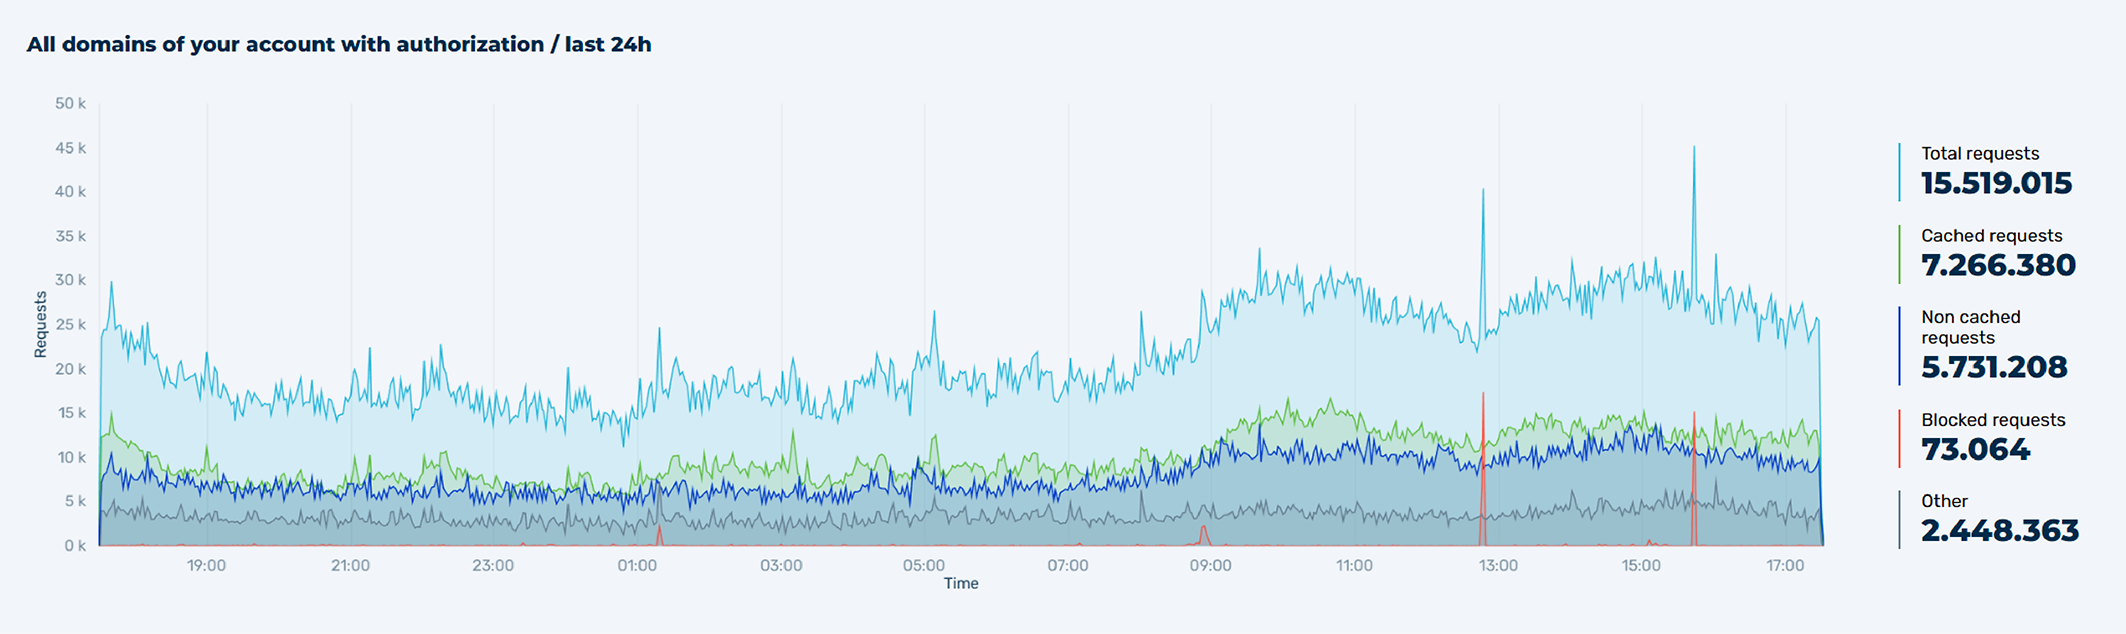
■ All domains of your account with authorization / last 24h
All domains of your account with authorization / last 24h
In this area, you will find a graphical representation of all requests (total / uncached / cached / blocked) from the last 24 hours. For a closer look at the graph, you can zoom in with your mouse to examine individual areas of the graph in more detail.
The following values are available:
Name Definition Total requests All requests in the period that shows. Cached requests The requests that were answered from the cache. Non cached requests The requests that were not answered from the cache. Blocked requests The requests that were blocked. Other All requests handled outside the main categories, for example redirects and CAPTCHA challenges. ℹ️ Note: If no data is available for the period, No Data shows.
-
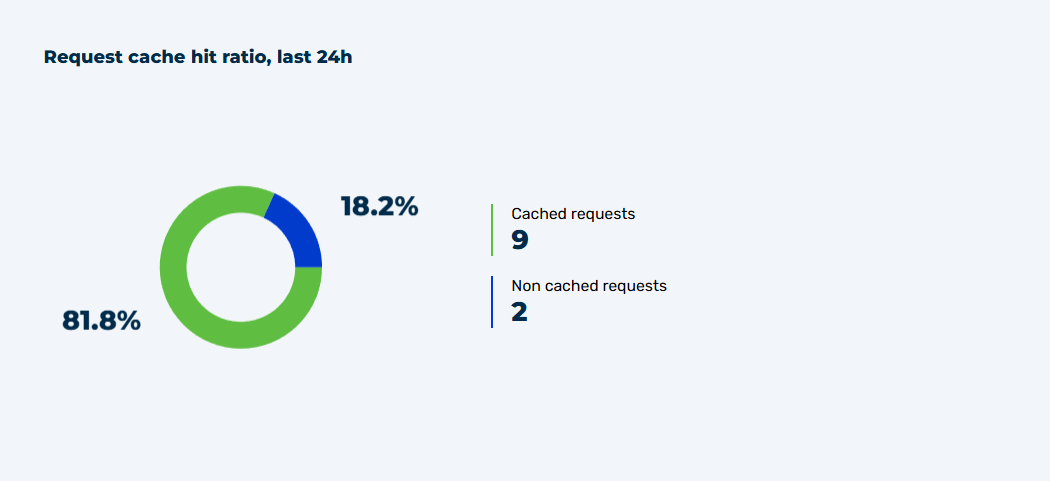
■ Request cache hit ratio, last 24h
Request cache hit ratio, last 24h
In this area, you will find an illustration of all cached (green) and uncached (blue) Request cache hit ratio from the last 24 hours.
-
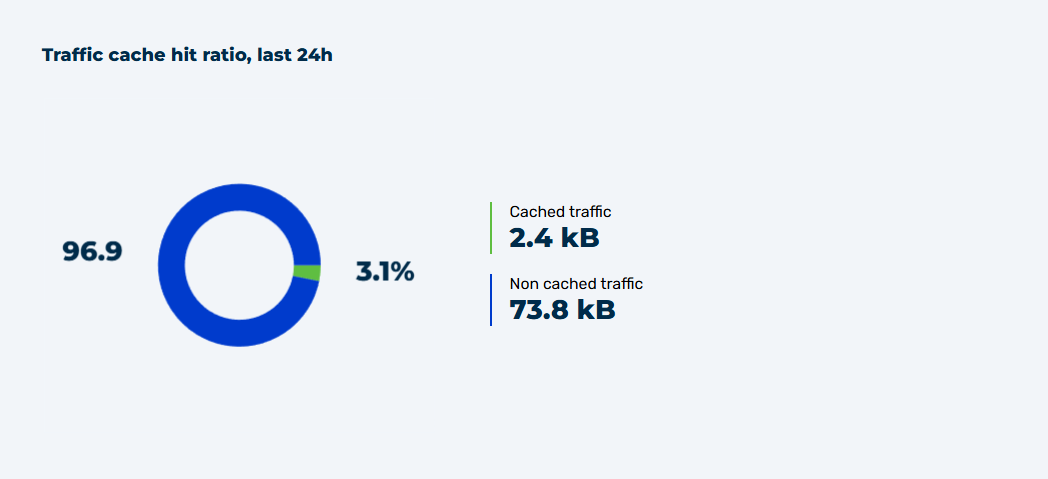
■ Traffic cache hit ratio, last 24h
Traffic cache hit ratio, last 24h
In this area, you will find an illustration of all cached (green) and uncached (blue) Traffic cache hit ratio from the last 24 hours.
-
■ Contact Myra
Contact Myra
In this area, you will find all the necessary contact details for Myra for general or technical inquiries.
The following information is available:
Name Definition Support hotline 24/7 & emergency The telephone number for technical malfunctions around the clock. Support hotline 9/5 (Mo - Fr, 9am - 6pm) The telephone number for technical inquiries during business hours. General support inquiries The contact address for general support inquiries. Sales The contact address of the sales team. Success Management Team The contact address of the Success Management Team. -
■ Services
Services
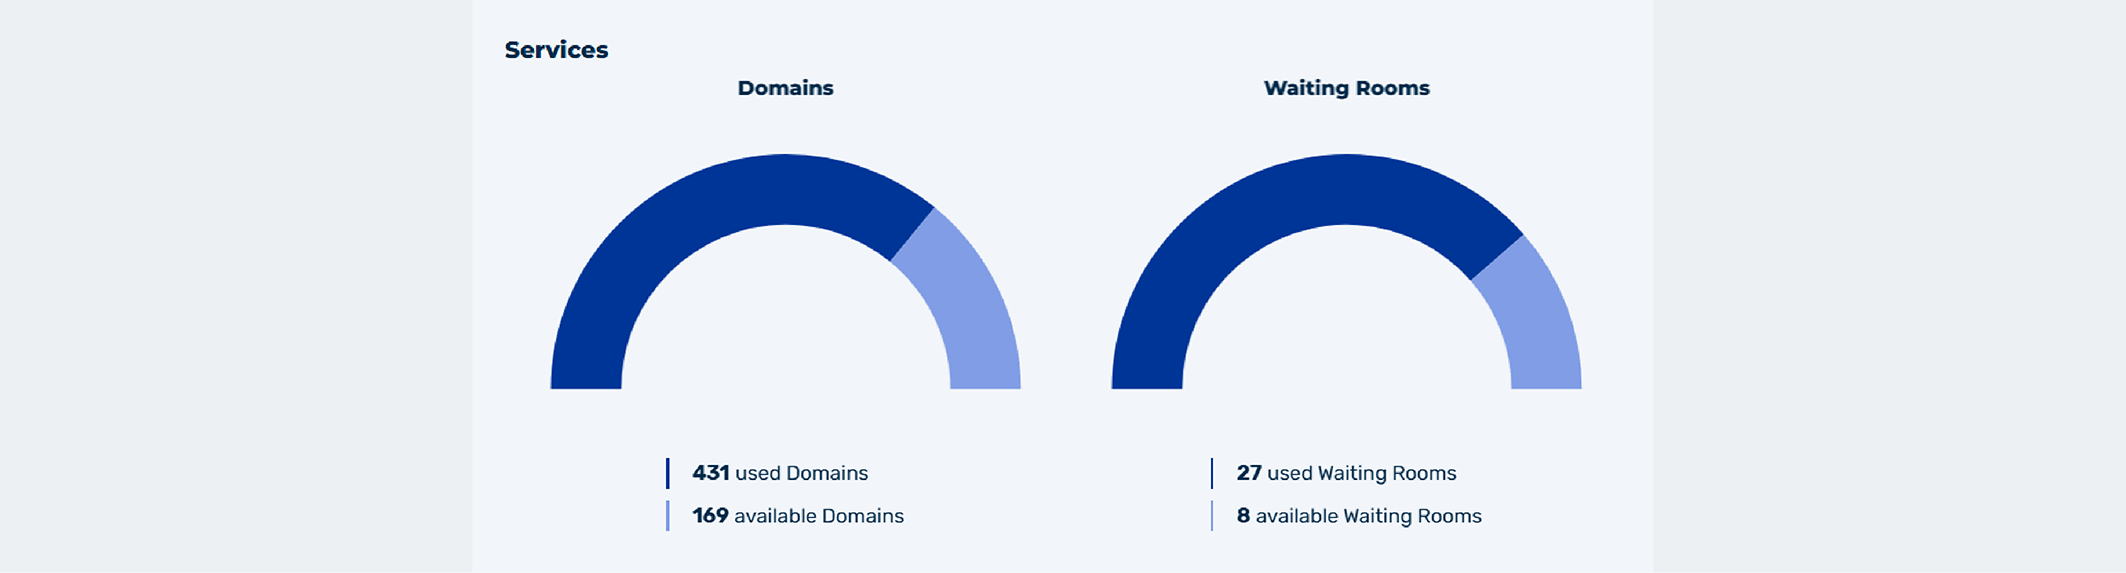
In this area, you can see how many domains and waiting rooms you have booked and how many of them are already in use.
The following information is available:
Name Definition Domains The number of used Domains and available Domains. Waiting Rooms The number of used Waiting Rooms and available Waiting Rooms.
Note
When you first launch the Myra App, the dashboard is empty and only the areas Contact Myra and Services contain information.