History Analysis
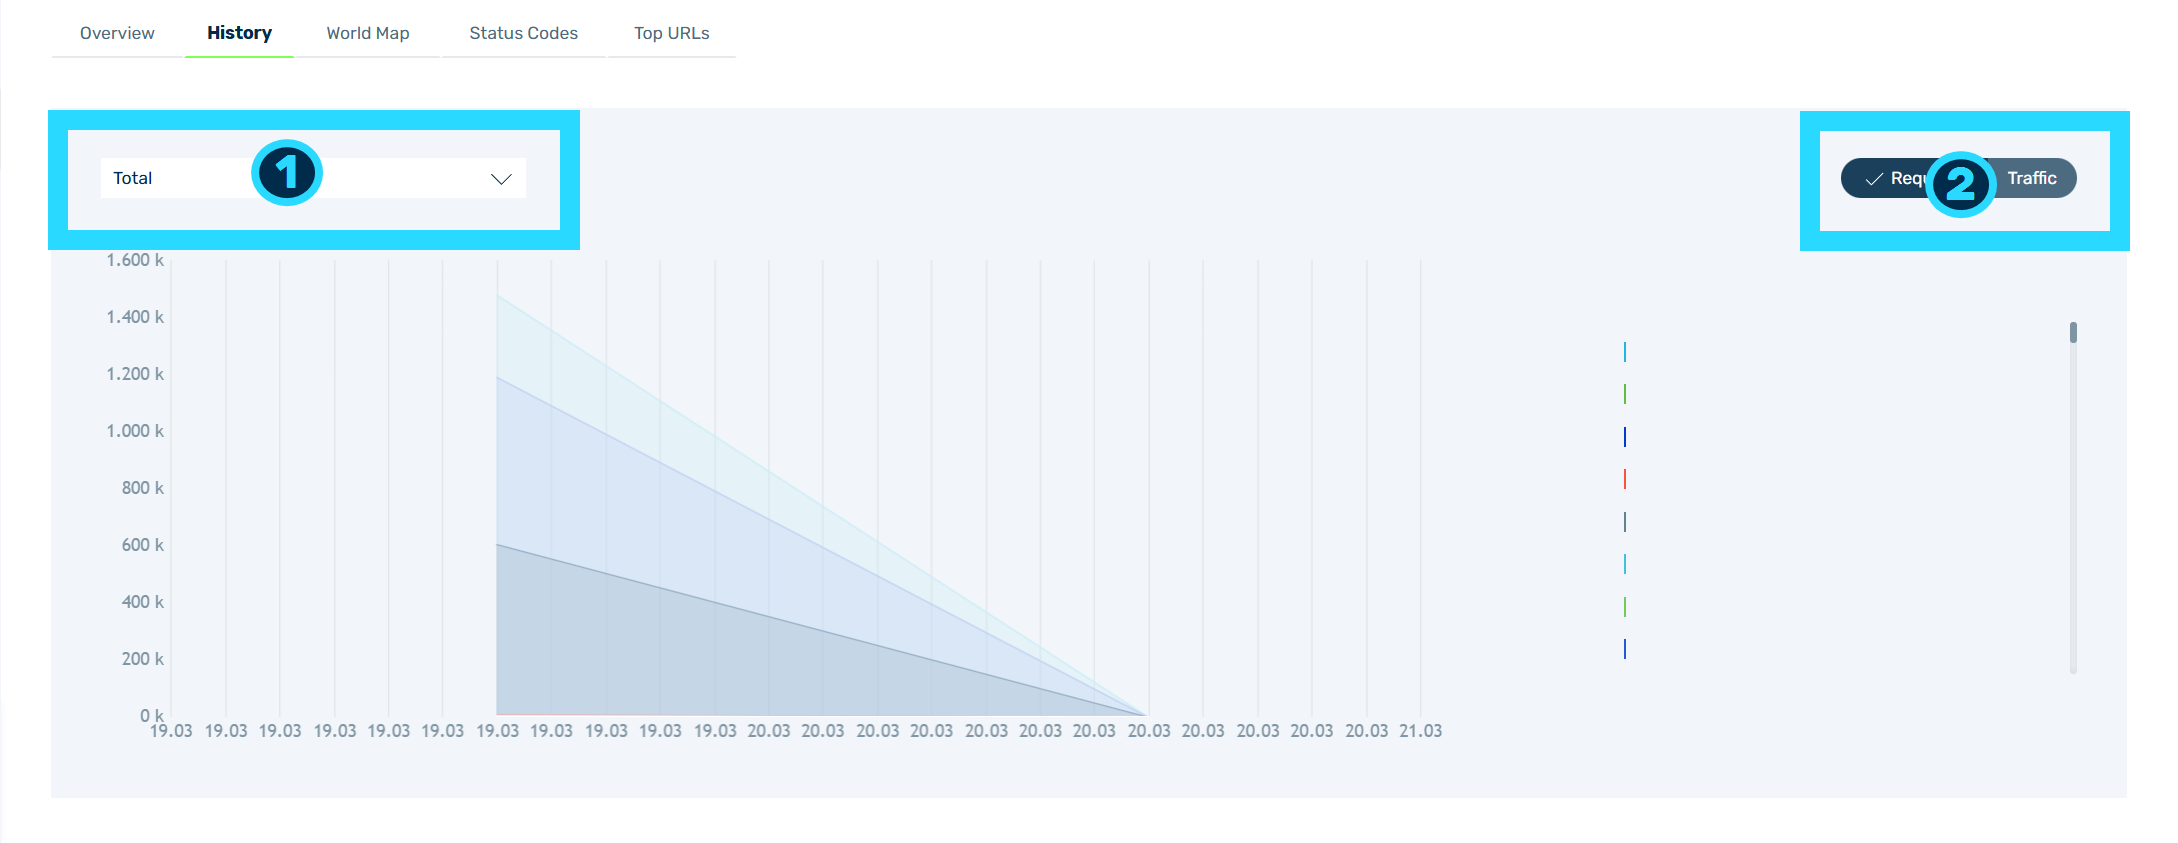
History Analysis
The History analysis shows a detailed analysis as graph of the requests, traffic, ASNs, status codes, and upstream times for the selected domains and subdomains during the specified time period.
The analysis includes the following areas:
- ■ The drop-down list in the top left-hand corner allows you to select the following filters to query specific analysis data (1):
| Name | Definition |
|---|---|
| Total | Shows all requests or the total traffic volume for the specified time period. |
| Total (without blocked) | Shows the total number of requests, excluding blocked requests, for the specified time period. |
| Request traffic | Shows the incoming traffic for the specified time period. |
| Response traffic | Shows the outbound traffic for the specified time period. |
| Blocked traffic by filter mechanism | Shows the traffic for the specified time period that was blocked by the filtering mechanisms of Myra. |
| Status codes | Shows the status codes that occurred during the specified time period. |
| Cached | Shows all cached requests or cached traffic for the specified time period. |
| Non cached | Shows all uncached requests or uncached traffic for the specified time period. |
| Cache ratio | Shows the cache ratio for requests or traffic for the specified time period. |
| Average upstream response time | Shows the average upstream time for the specified time period. |
| ASN types | Shows the recorded ASN types for the specified time period. |
- ■ The buttons Requests and Traffic allow you to switch between analysing requests and traffic in some filters (2).
The following values show below the graph:
| Name | Definition |
|---|---|
| Total | The sum of the values in the period that shows. |
| Average | The average of the values in the period that shows. |
| Selection | The sum of the values of the area selected in the graph. |
Note
The graph shows one line for each selected domain if you selected only domains. If you selected subdomains, the graph shows one line for each subdomain.
If no data is available for the specified time period, No match found shows.